The Council of the American Physical Society (APS) has adopted on April 18, 2010 a "Climate Change Commentary" to append to their
definitive and "incontrovertible" 2007 policy statement on climate change. The
commentary allows considerable backpedaling from the prior policy while appearing to save face. The commentary removes the word
incontrovertible because such words are "rarely used in science because by its very nature science questions prevailing ideas." The statement "
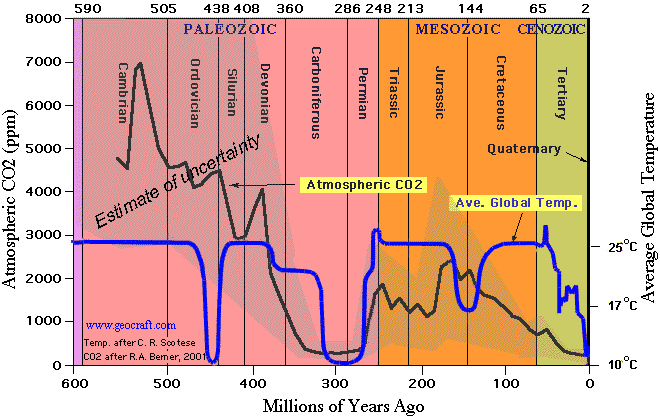
While there are factors driving the natural variability of climate (e.g., volcanoes, solar variability, oceanic oscillations), no known natural mechanisms have been proposed that explain all of the observed warming in the past century." is added, and while not true since there are a number of papers which show that ocean oscillations and solar variability can explain all of the 0.7 degree warming of the past century, it is a step in the right direction from the 2007 policy which makes no mention of natural forcing and blames climate change on man-made emissions of CO2.
For the first time there is acknowledgement of the uncertainties associated with models, including the statement "
These models have uncertainties associated with radiative response functions, especially clouds and water vapor. However, the models show that water vapor has a net positive feedback effect (in addition to CO2 and other gases) on global temperatures. The impact of clouds is less certain because of their dual role as scatterers of incoming solar radiation and as greenhouse contributors." While it is true the models show net positive feedback, that is only because that is how they were programmed, and no mention is made of the
empirical satellite and weather balloon data which show the net feedback is actually negative. At least, the
commentary begins to indicate large uncertainties with climate modeling.
The commentary adds "
The uncertainty in the estimates from various climate models for doubling CO2-equivalent concentration is in the range of 1°C to 3°C with the probability distributions having long tails out to much larger temperature changes.", without mentioning that 1
°C global warming is what is expected from the no feedback model and even less from the negative feedback model as supported by data, which is likely to be beneficial and is hardly cause for alarm or cap & tax schemes. As Richard Lindzen and Roy Spencer have repeatedly pointed out, the real issue to be determined is the sensitivity of the climate to changes in CO2, for which all the empirical data show the models have greatly overestimated sensitivity. If there is low sensitivity, there is no cause for alarm.
Here is the original 2007 policy, followed by the new Commentary:
National Policy07.1 CLIMATE CHANGE(Adopted by Council on November 18, 2007)
Emissions of greenhouse gases from human activities are changing the atmosphere in ways that affect the Earth's climate. Greenhouse gases include carbon dioxide as well as methane, nitrous oxide and other gases. They are emitted from fossil fuel combustion and a range of industrial and agricultural processes.
The evidence is incontrovertible: Global warming is occurring. If no mitigating actions are taken, significant disruptions in the Earth’s physical and ecological systems, social systems, security and human health are likely to occur. We must reduce emissions of greenhouse gases beginning now.
Because the complexity of the climate makes accurate prediction difficult, the APS urges an enhanced effort to understand the effects of human activity on the Earth’s climate, and to provide the technological options for meeting the climate challenge in the near and longer terms. The APS also urges governments, universities, national laboratories and its membership to support policies and actions that will reduce the emission of greenhouse gases.
Climate Change Commentary(adopted by Council on April 18, 2010)
There is a substantial body of peer reviewed scientific research to support the technical aspects of the 2007 APS statement. The purpose of the following commentary is to provide clarification and additional details.
The first sentence of the APS statement is broadly supported by observational data, physical principles, and global climate models. Greenhouse gas emissions are changing the Earth's energy balance on a planetary scale in ways that affect the climate over long periods of time (~100 years). Historical records indicate that the Earth’s climate is sensitive to energy changes, both external (the sun’s radiative output, changes in Earth’s orbit, etc.) and internal. Internal to our global system, it is not just the atmosphere, but also the oceans and land that are involved in the complex dynamics that result in global climate. Aerosols and particulates resulting from human and natural sources also play roles that can either offset or reinforce greenhouse gas effects. While there are factors driving the natural variability of climate (e.g., volcanoes, solar variability, oceanic oscillations), no known natural mechanisms have been proposed that explain all of the observed warming in the past century. Warming is observed in land-surface temperatures, sea-surface temperatures, and for the last 30 years, lower-atmosphere temperatures measured by satellite. The second sentence is a definition that should explicitly include water vapor. The third sentence notes various examples of human contributions to greenhouses gases. There are, of course, natural sources as well.
The evidence for global temperature rise over the last century is compelling. However, the word "incontrovertible" in the first sentence of the second paragraph of the 2007 APS statement is rarely used in science because by its very nature science questions prevailing ideas. The observational data indicate a global surface warming of 0.74 °C (+/- 0.18 °C) since the late 19th century. (Source: http://www.ncdc.noaa.gov/oa/climate/globalwarming.html)
The second sentence in the second paragraph states that without mitigating actions significant disruptions in the Earth's physical and ecological systems, social systems, security and health are likely. Such predicted disruptions are based on direct measurements (e.g., ocean acidification, rising sea levels, etc.), on the study of past climate change phenomena, and on climate models. Climate models calculate the effects of natural and anthropogenic changes on the ecosphere, such as doubling of the CO2-equivalent [1] concentration relative to its pre-industrial value by the year 2100. These models have uncertainties associated with radiative response functions, especially clouds and water vapor. However, the models show that water vapor has a net positive feedback effect (in addition to CO2 and other gases) on global temperatures. The impact of clouds is less certain because of their dual role as scatterers of incoming solar radiation and as greenhouse contributors. The uncertainty in the net effect of human activity on climate is reflected in the broad distribution of the predicted magnitude of the consequence of doubling of the CO2-equivalent concentration. The uncertainty in the estimates from various climate models for doubling CO2-equivalent concentration is in the range of 1°C to 3°C with the probability distributions having long tails out to much larger temperature changes.
The last sentence in the second paragraph articulates an immediate policy action to reduce greenhouse gas emissions to deal with the possible catastrophic outcomes that could accompany large global temperature increases. Even with the uncertainties in the models, it is increasingly difficult to rule out that non-negligible increases in global temperature are a consequence of rising anthropogenic CO2. Thus given the significant risks associated with global climate change, prudent steps should be taken to reduce greenhouse gas emissions now while continuing to improve the observational data and the model predictions.
The third paragraph, first sentence, recommends an enhanced effort to understand the effects of human activity on Earth's climate. This sentence should be interpreted broadly and more specifically: an enhanced effort is needed to understand both anthropogenic processes and the natural cycles that affect the Earth's climate. Improving the scientific understanding of all climate feedbacks is critical to reducing the uncertainty in modeling the consequences of doubling the CO2-equivalent concentration. In addition, more extensive and more accurate scientific measurements are needed to test the validity of climate models to increase confidence in their projections.
With regard to the last sentence of the APS statement, the role of physicists is not just "...to support policies and actions..." but also to participate actively in the research itself. Physicists can contribute in significant ways to understanding the physical processes underlying climate and to developing technological options for addressing and mitigating climate change.
[1] The concentration of CO2 that would give the same amount of radiative impact as a given mixture of CO2 and other greenhouse gases (methane, nitrous oxide, etc.). The models sum the radiative effects of all trace gases and treat the total as if it comes from an "equivalent" CO2 concentration. The calculation for all gases other than CO2 takes into account only increments relative to their pre-industrial values, so that the pre-industrial effect for CO2 and CO2-equivalent are the same.


