A paper published today in the Journal of Climate finds that in "one of the most variable [disrupted?] climates of the world" - the Northeastern US - "Although maximum temperatures indices showed strong warming trends over the period 1893 – 1950, subsequent trends show little change and cooling."
Journal of Climate 2010 ; e-View doi: 10.1175/2010JCLI3363.1
Changes in extreme climate indices for the northeastern U.S., 1870 – 2005.
Paula J. Brown*, Raymond S. Bradley, Frank T. Keimig
Climate System Research Center, Department of Geosciences, University of Massachusetts, Amherst, Massachusetts
Abstract: The northeastern U.S. is one of the most variable climates in the world, and how climate extremes are changing is critical to populations, industries and the environment in this region. A long-term (1870 – 2005) temperature and precipitation dataset was compiled for the northeast U.S. to assess how the climate has changed. Adjustments were made to daily temperatures to account for changes in mean, variance and skewness resulting from inhomogeneities, but precipitation data were not adjusted. Trends in 17 temperature and 10 precipitation indices at 40 stations were evaluated over three time periods: 1893 – 2005, 1893 – 1950 and 1951 – 2005, and over 1870 – 2005 for a subset of longer term stations. Temperature indices indicate strong warming with increases in the frequency of warm events (e.g. warm nights and warm summer days) and decreases in the frequency of cold events (e.g. ice days, frost days and the cold spell duration indicator). The strongest warming is exhibited in the decrease in frost days and the increase in growing season length. Although maximum temperatures indices showed strong warming trends over the period 1893 – 1950, subsequent trends show little change and cooling. Few significant trends were present in the precipitation indices; however, they displayed a tendency toward wetter conditions. A stepwise multiple linear regression analysis indicated some of the variability the 27 indices from 1951 – 2002 was explained by the [naturally occuring] North Atlantic Oscillation, Pacific Decadal Oscillation and Pacific North American pattern. However, teleconnection patterns showed little influence on the 27 indices over a 103-year period.
More evidence of natural variability/disruption also published today in the Journal of Climate:
The Influence of El Niño – Southern Oscillation and the Atlantic Multi-decadal Oscillation on Caribbean Tropical Cyclone Activity
Philip J. Klotzbach
Abstract: Caribbean basin tropical cyclone activity shows significant variability on inter-annual as well as multi-decadal timescales. Comprehensive statistics for Caribbean hurricane activity are tabulated, and then large-scale climate features are examined for their impacts on this activity. The primary inter-annual driver of variability is found to be El Niño–Southern Oscillation, which alters levels of activity due to changes in levels of vertical wind shear as well as through column stability. Much more activity occurs in the Caribbean with La Niña conditions than with El Niño conditions. On the multi-decadal timescale, the Atlantic Multi-decadal Oscillation is shown to play a significant role in Caribbean hurricane activity, likely linked to its close relationship with multi-decadal alterations in the size of the Atlantic Warm Pool and the phase of the Atlantic Meridional Mode. When El Niño – Southern Oscillation and the Atlantic Multi-decadal Oscillation are examined in combination, even stronger relationships are found due to a combination of either favorable or unfavorable dynamic and thermodynamic factors. For example, 29 hurricanes tracked into the Caribbean in the ten strongest La Niña years in a positive Atlantic Multi-decadal Oscillation period compared with only two hurricanes tracking through the Caribbean in the ten strongest El Niño years in a negative Atlantic Multi-decadal Oscillation period.
Wednesday, September 29, 2010
Tuesday, September 28, 2010
Overharvested Horseshoe Crabs, existent 400 million years, now endangered by tiny temp & sea level changes
From the "You can only get grant funding & publicity if you link it to climate change department," comes a press release on a new study noting the 400 million year old "living fossil" horseshoe crab is endangered due to climate change, such as sea levels currently rising 1.85 mm/yr [compared to the average 7 mm/yr since the last ice age] and water temperature increase [actually the oceans have been cooling since 2003]. Oh, and by the way, over-harvesting, destroyed habitats, use as fishing bait and in the pharmaceutical industry might play a minor role.
But first, a couple graphs for a historical perspective on sea temperatures and sea levels covering just a small fraction of the 400 million years horseshoe crabs have been around:


Climate change is shrinking stocks of the dagger tail
2010-09-24 Press Release Göteborg University (Google translation)
 |
| Horseshoe crabs stranded in Port Mahon, Delaware Bay, USA. Stones placed at the water's edge to protect the coast prevents dagger tails from returning to their spawning grounds. |
The sea dagger tail [a.k.a. horseshoe crab], which has existed for more than 400 million years, is threatened. Researchers from Gothenburg University can now show how vulnerable populations to climate change. The results of the study recently published in the scientific journal Molecular Ecology. Dagger tails is often regarded as living fossils, which have survived almost unchanged in terms of body design and lifestyle for more than 400 million years. Animals similar to today's dagger tails were on earth long before dinosaurs.
- By examining the genetic variation within populations of dagger tails along the U.S. east coast, we have been able to track changes in population size through time. We noticed a marked decline in the number of dagger tails during the ice age final stage, a period characterized by a significant global warming, "says researcher Matthias Obst of Zoology, Göteborg University and co-authorship of the study published in the journal Molecular Ecology.
- Our results show that the current, already severely shrunken stocks, likely will continue to decline in future climate change.
All four species of dagger tails are endangered due to over-harvesting, the animals use as fishing bait and in the pharmaceutical industry. Destroyed habitats around the beaches that are the animals' spawning grounds also contributes to the decline. Scientists predict now that dagger tails will be further reduced in number by future climate change. "The most decisive factor is the impending changes in sea level and water temperature. These environmental changes are likely to affect the animals' distribution and reproduction very negatively, " says Matthias Obst.
Monday, September 27, 2010
Sign of the Times: Not even online readers of 'Scientific' American or Nature 'Trust' Scientists on Climate Change
A new "in science we trust" poll is out surveying the online readership of 'Scientific' American and Nature with some eye-opening results. The purpose was to find out whether the "public" still trusts scientists on controversial issues in the wake of climategate and other recent scientific scandals. Even amongst the "highly educated" online readership, many of whom are scientists themselves, the poll results show that trust in scientists to provide accurate information on climate change couldn't make it over the 'trust' hump and were far away from 'highly trust.'
 The 'Scientific' American article mentions once the biased nature of the sample and everywhere else in the article equates the results with the general public in violation of statistics 101. The hate speech of the D-word is also utilized:

Numerous polls show a decline in the percentage of Americans who believe humans affect climate, but our survey suggests the nation is not among the worst deniers. (Those are France, Japan and Australia.)Multiple polls worldwide now show only 30-40% of the public at large believe in human-induced climate change. Thus, 'Scientific' American effectively manages to insult many of its international online readers as 'deniers' and insults the majority of the international public at large as 'deniers.' Why don't they also label anyone who doubts the science on any of the other topics above as 'deniers?'
IPCC Scientist: Bias and corruptibility of the IPCC’s assessment process are of substantial concern
Dr. Judith Curry, IPCC scientist and Chair of the School of Earth and Atmospheric Sciences at the Georgia Institute of Technology, has a highly recommended post at her new blog today, No consensus on consensus. Selected quotes are below:
I think the IPCC consensus approach was valuable in the 1990’s and arguably through the third IPCC Assessment Report, in terms of sorting through and assessing the large amount of scientific research on the topic. The Nobel Peace Prize notwithstanding, questions regarding bias and the corruptibility of the IPCC’s consensus-based assessment process are of substantial concern.Please visit Dr. Curry's blog for the entire essay and comments
while the IPCC consensus approach has been effective in communicating climate science to policy makers, it has marginalized dissenting voices.
...a complete characterization of uncertainty is more important than consensus. While I understand the policy makers’ desire for a clear message from the scientists, at this point the consensus approach being used by the IPCC doesn’t seem to be up to challenge of an accurate portrayal of the complexities of the problem and the uncertainties.
...a more realistic portrayal of confidence levels would go a long way towards reducing the “noise” and animosity portrayed in the media that fuels the public distrust of climate science and acts to stymie the policy process.
The legal memo framework requires providing evidence for and against, and a full characterization of the uncertainties. Subsequent arguments based on the legal brief model would then stake out a specific positions on policy options and their justification (based upon science, economics, politics, values, etc.), with extensive follow-on cross examination of all briefs that are presented. This framework would broaden the assessment scope and allow for a range of perspectives, providing a better informational basis for decision making on this complex issue.
The formal process of achieving consensus requires serious treatment of the considered opinion of each group member, noting that discussion of opposing views enhances the value of the ultimate consensus.
Sunday, September 26, 2010
Shattering the Greenhouse Effect
A recommended essay by Swedish climatologist Dr. Hans Jelbring offers a high school through advanced level debunking of the so-called 'greenhouse effect.' Dr. Jelbring finds that basic scientific principles demonstrate that global temperatures are not controlled by human emissions of 'greenhouse gases' and the 'greenhouse effect' is explainable using only the physics of pressure, gravity, volume, and the adiabatic lapse rate.
Essay from source ilovemycarbondioxide.com has been edited to remove references to Swedish law and politics. Please visit source for more recommended essays

...The IPCC is biased from the start by its mandate. It only covers the impact on climate caused by man (anthropogenic or AGW) which is reductionism that does not conform to scientific methods. Furthermore, the IPCC has chosen not to investigate those types of local, regional and national global anthropogenic impacts which actually do exist. The IPCC has emphasized the importance of an unverified, simplistic model that predicts a particular surface temperature of earth as being caused by “greenhouse gases”. These are specifically identified as carbon dioxide and methane. Water vapor, the most abundant greenhouse gas, is wrongly assumed to be “a quantifiable feedback” to carbon dioxide, which is 50 times less abundant than water vapour in the atmosphere. Such a model is far too inexact and speculative to describe the complex climate system. This type of logic does not conform to accepted scientific methodology.
The major IPCC claim is that greenhouse gases are the sole reason why the average surface temperature of earth is 33ºC warmer than the temperature at an average altitude of around 4000 m, where the infrared photons prefer to leave our planet. (Seen from Mars the temperature of earth is -18 ºC). The pertinent question is: do greenhouse gases raise the global temperature 0.1, 10 or 100% of the observed 33ºC? There are many indications that the first alternative is the most probable. Let us mention a few ways the IPCC “greenhouse gas” claim can be debunked.
I. The high school approach.
The average sea level pressure is around 1013 mbar. If you live at a higher altitude the pressure will be less. Your barometer at 100 m above sea level will read about 12 mbar less. Pressure is a direct measurement of how much atmospheric mass there is above your head per square meter. The ideal gas law can be written PV = RT where P is the pressure (Pascal), V is the volume (m3), R is the gas constant (Joule/K) and T is the average temperature (over some days). Let us now calculate the temperature in a 1 m3 volume at any height. Hence T = P/R, T is proportional to P and P is known from observation to decrease with increasing altitude. It follows that the average T has to decrease with altitude. This decrease from the surface to the average infrared emission altitude around 4000 m is 33ºC. It will be about the same even if we increase greenhouse gases by 100%. This is a consequence of the ideal gas law, a natural law which politicians cannot change, but unscrupulous scientists can twist.
II. Observational evidence
On any sunny day the solar irradiation hitting the surface of earth will warm the air just above it which will then start to lift. A black ground surface, such as a parking place or a newly plowed field, will absorb more solar energy and subsequently heat the air more than surfaces of lighter colours. Hawks and vultures know about this phenomenon, allowing them to be able to hover above such surfaces without moving their wings. The temperature decrease with elevation in such a situation is very close to the dry adiabatic temperature lapse rate which can be derived theoretically. It is -9.8ºC/km. Everyday observational evidence and theoretical derivations show that the temperature lapse rate in such situations can be determined without consideration of any influence at all from greenhouse gases, whether they are of anthropogenic origin or not. Hence, GE has to be a function of other processes than “greenhouse gases”. The question remains if CO2 has a measurable influence, at all.
III. Advanced theoretical considerations
The theoretical temperature lapse rate that can be expected to be found in the earth’s atmosphere depends on a number of physical processes that are possible to identify. The GE is basically determined by the first and second laws of thermodynamics. The energy per mass unit of an atmosphere will tend to equalize and become constant from the surface upwards. This will lead to an average vertical cooling rate defined by –g/Cp, (g is gravity and Cp heat capacity of air) which also is named the dry adiabatic temperature lapse rate. This lapse rate is modulated by condensation processes in the atmospheres (clouds) and other less important physical processes. The influence of greenhouse gases is small. These additional processes lead to an average observed global temperature lapse rate around -6.5C/km (ref 1). This temperature decrease can be directly verified by any airplane passenger. A strict proof showing that there is no theoretical reason to assume that greenhouse gases cause the bulk of the 33 ºC GE can be found in the peer reviewed article in ref (2). There are several other relevant articles in scientific journals.
Atmospheric Temperature Distribution in a Gravitational Field Author: William C. Gilbert
There still seems to be some confusion in the Climate Science Community about the temperature distribution in a gaseous atmosphere under the influence of a gravitational field. My academic degrees are in Chemical Engineering and Chemistry and I have spent over three decades in Research and Development in private industry (DuPont, Monsanto, Celanese and American Cyanamid). I became interested in Climate Science some four years ago because it seemed to be a perfect fit with my Chemical Engineering background (large, complex, multi-variant systems involving significant heat and mass transfer processes) and I thought I may be able to contribute something. I was immediately amazed at the paltry level of scientific competence that I found, especially in the basic areas of heat and mass transfer. Even the relatively simple analysis of atmospheric temperature distributions were misunderstood completely. To illustrate the level of simplicity involved with this topic, let's go back to basic physics.
Consider a vertical gas column containing a finite and constant specific energy level (U, J/kg) that is isolated from its surroundings (no input/output of energy or mass) but which is in a gravitational field. The column will in time reach equilibrium with respect to internal specific energy but the temperature will not be uniform. At static equilibrium (adiabatic equilibrium where no macro motion exists), internal specific energy (U) is composed of both thermal energy (the energy due to molecular motion) and potential energy (the energy due to
position). The latter has to exist in a gravitational field. Thus, according to the first and second law of thermodynamics, the specific internal energy (U) for any mass parcel in the air column has to be constant and can be expressed as a sum of the thermal and potential energies. This law (expressed as specific energies) can be written:
U = CpT + gh or upon differentiation dU = CpdT + gdh (1)
where “CpT” is the enthalpy (or thermal energy) per mass unit, “g” is the gravitational acceleration, “h” is the vertical height and “gh” is the potential energy per mass unit.
At static equilibrium dU = 0 and equation (1) becomes;
CpdT + gdh = 0 (2)
Thus, according to the first and second laws of thermodynamics, for any given difference in altitude (height) the increase in specific potential energy (gdh) must be offset by a corresponding decrease in thermal energy (CpdT) and a corresponding decrease in temperature. Thus in a gravitational field an atmosphere in equilibrium must have a non- isothermal decreasing temperature distribution with altitude. This is true in an isolated air column and this basic physical phenomenon exists independent of any input/output of other energy sources such as ground temperature, convection, radiation, convection, etc. And of course equation (2) can be rewritten as:
dT/dh = -g/CpT = -9.8 K/km
which is a temperature profile often observed in our atmosphere on a daily basis. This static temperature lapse rate (in this model atmosphere) is identical to the dry adiabatic lapse rate theoretically derived in Meteorology for a convective adiabatic air parcel. In both situations it is solely a function of the magnitude of the gravitational field and the heat capacity of the atmospheric gas, and nothing else. And this relationship aptly describes the bulk of the 33ºC so-called “Greenhouse Effect” that is the bread and butter of the Climate Science Community.
It is remarkable that this very simple derivation is totally ignored in the field of Climate Science simply because it refutes the radiation heat transfer model as the dominant cause of the GE. Hence, that community is relying on an inadequate model to blame CO2 and innocent citizens for global warming in order to generate funding and to gain attention. If this is what “science” has become today, I, as a scientist, am ashamed.
References:
1. The US 1976 standard atmosphere: http://modelweb.gsfc. nasa.gov/atmos/us_standard.html and
http://www.digitaldutch.com/atmoscalc/index.htm
2. Jelbring, Hans R. The Greenhouse Effect as a Function of Atmospheric Mass, Energy and Environment, Vol.
14, Nr 2&3, 2003.
3. Jelbring, Hans R. Thesis, 1998, Wind Controlled Climate, Paleogeophysics & Geodynamics, Stockholm
University.
Saturday, September 25, 2010
Paper: Roman & Medieval Warming Period Temps Reached or Exceeded the 20th Century
A new paper utilizing "many" records never previously included in reconstructions of past temperatures finds that the Roman & Medieval Warming Period temperatures reached or exceeded those of the latter 20th century. Unfortunately, the paper still resorts to the old Michael Mann tactic of tacking on the instrumental thermometer record at the end for an apples and oranges comparison, but at least they are up-front about it.
A NEW RECONSTRUCTION OF TEMPERATURE VARIABILITY IN THE EXTRA-TROPICAL NORTHERN HEMISPHERE DURING THE LAST TWO MILLENNIA
Author: FREDRIK CHARPENTIER LJUNGQVIST
Geografiska Annaler: Series A, Physical Geography Volume 92, Issue 3, pages 339–351, September 2010
Article first published online: 6 SEP 2010 DOI: 10.1111/j.1468-0459.2010.00399.x
Abstract: A new temperature reconstruction with decadal resolution, covering the last two millennia, is presented for the extratropical Northern Hemisphere (90–30°N), utilizing many palaeo-temperature proxy records never previously included in any large-scale temperature reconstruction. The amplitude of the reconstructed temperature variability on centennial time-scales exceeds 0.6°C. This reconstruction is the first to show a distinct Roman Warm Period c. ad 1–300, reaching up to the 1961–1990 mean temperature level, followed by the Dark Age Cold Period c. ad 300–800. The Medieval Warm Period is seen c. ad 800–1300 and the Little Ice Age is clearly visible c. ad 1300–1900, followed by a rapid temperature increase in the twentieth century [doesn't look to me to be any more rapid than from 700 to 1000 AD]. The highest average temperatures in the reconstruction are encountered in the mid to late tenth century and the lowest in the late seventeenth century. Decadal mean temperatures seem to have reached or exceeded the 1961–1990 mean temperature level during substantial parts of the Roman Warm Period and the Medieval Warm Period. The temperature of the last two decades, however, is possibly higher than during any previous time in the past two millennia, although this is only seen in the instrumental temperature data and not in the multi-proxy reconstruction itself. Our temperature reconstruction agrees well with the reconstructions by Moberg et al. (2005) and Mann et al. (2008) with regard to the amplitude of the variability as well as the timing of warm and cold periods, except for the period c. ad 300–800, despite significant differences in both data coverage and methodology.
UPDATE: just noticed the NIPPC has a write up on this paper
 |
| Year AD on x axis, temp anomaly on y axis, added red line showing temp at year 2000, red dashed line is the tacked on thermometer record, MWP = Medieval Warming Period, RWP=Roman Warming Period |
Author: FREDRIK CHARPENTIER LJUNGQVIST
Geografiska Annaler: Series A, Physical Geography Volume 92, Issue 3, pages 339–351, September 2010
Article first published online: 6 SEP 2010 DOI: 10.1111/j.1468-0459.2010.00399.x
Abstract: A new temperature reconstruction with decadal resolution, covering the last two millennia, is presented for the extratropical Northern Hemisphere (90–30°N), utilizing many palaeo-temperature proxy records never previously included in any large-scale temperature reconstruction. The amplitude of the reconstructed temperature variability on centennial time-scales exceeds 0.6°C. This reconstruction is the first to show a distinct Roman Warm Period c. ad 1–300, reaching up to the 1961–1990 mean temperature level, followed by the Dark Age Cold Period c. ad 300–800. The Medieval Warm Period is seen c. ad 800–1300 and the Little Ice Age is clearly visible c. ad 1300–1900, followed by a rapid temperature increase in the twentieth century [doesn't look to me to be any more rapid than from 700 to 1000 AD]. The highest average temperatures in the reconstruction are encountered in the mid to late tenth century and the lowest in the late seventeenth century. Decadal mean temperatures seem to have reached or exceeded the 1961–1990 mean temperature level during substantial parts of the Roman Warm Period and the Medieval Warm Period. The temperature of the last two decades, however, is possibly higher than during any previous time in the past two millennia, although this is only seen in the instrumental temperature data and not in the multi-proxy reconstruction itself. Our temperature reconstruction agrees well with the reconstructions by Moberg et al. (2005) and Mann et al. (2008) with regard to the amplitude of the variability as well as the timing of warm and cold periods, except for the period c. ad 300–800, despite significant differences in both data coverage and methodology.
UPDATE: just noticed the NIPPC has a write up on this paper
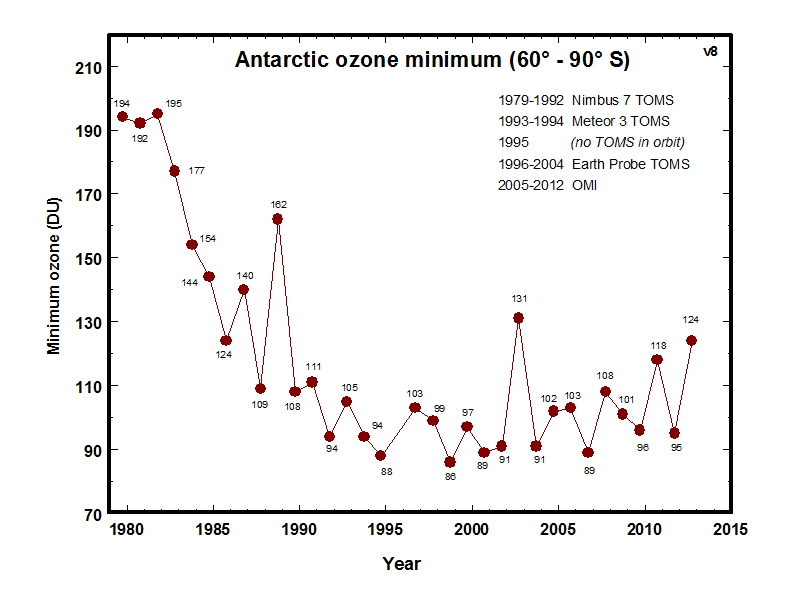
Paper: Ozone 2-3 times more important than CO2
From the annals of The (one & only) incontrovertible, settled science where the evidence is growing stronger every day about climate destruction from CO2 pollution, comes the publication today of a paper in the Journal of the American Meteorological Association finding that it is ozone depletion, not CO2, that was the dominant "main driver" or "forcing" parameter of the second half of the 20th century southern hemisphere climate. Meanwhile, the IPCC maintains with > 90% 'confidence' a.k.a. 'false consensus' that it is CO2 which is responsible for 97% of all positive forcing of climate. Is the IPCC the real 'denier' that CO2 is a bit player at most?

Stratospheric ozone depletion: the main driver of 20th Century atmospheric circulation changes in the Southern Hemisphere
Authors: Lorenzo M. Polvani, Darryn W. Waugh, Gustavo J. P. Correa, Seok-Woo Son
Abstract: The importance of stratospheric ozone depletion on the atmospheric circulation of the troposphere is studied with an atmospheric general circulation model, the Community Atmospheric Model, version 3 (CAM3), for the second half of the 20th century. In particular, the relative importance of ozone depletion is contrasted with that of increased greenhouse gases and accompanying sea surface temperature changes. By specifying ozone and greenhouse gas forcings independently, and performing long, time-slice integrations, it is shown that the impacts of ozone depletion are roughly two to three times larger than those associated with increased greenhouse gases, for the Southern Hemisphere tropospheric summer circulation. The formation of the ozone hole is shown to affect not only the polar tropopause and the latitudinal position of the midlatitude jet: it extends to the entire hemisphere, resulting in a broadening of the Hadley cell and a poleward extension of the subtropical dry zones. The CAM3 results are compared to and found to be in excellent agreement with those of the multi-model means of the recent Coupled Model Intercomparison Project (CMIP3) and Chemistry-Climate Model Validation (CCMVal2) simulations. This study, therefore, yields a direct attribution of most Southern Hemisphere tropospheric circulation changes, in the second half of the 20th century, to stratospheric ozone depletion.
Windfall
A documentary which recently premiered at the Toronto Film Festival, Windfall, examines a small farming community in New York that "finds that wind energy may be nothing more than hot air" when the massive wind industry comes to town. The trailer below is a must see, and explains why Ted Kennedy didn't want offshore wind turbines obstructing his views on Cape Cod, but advocated for them near the "little people" such as in this documentary. Think about the 146,000,000 wind turbines required to allegedly solve global warming the next time you vote for a 'green' politician.
another review
h/t the Portuguese blog EcoTretas
another review
h/t the Portuguese blog EcoTretas
Thursday, September 23, 2010
Look out: Record Breaking La Niña Occurring?
From a discussion board at NOAA comes this graph showing the developing La Niña of 2010 might be a record breaker. La Niña causes multiple global climate disruptions including a drop in global temperatures and extreme weather events around the globe, which no doubt will still be conveniently blamed on mankind's evil ways. The last 2 times of record-contending La Ninas in 1954 and 1973 were during the global cooling scare:
Global temperatures drop about 6 months after a drop in the Pacific Decadal Oscillation (PDO), which is similar to but not the same as the El Niño-La Niña Index, as shown in the graph below. Look out for an extra cold winter and some cold water splashed on the claim "2010 is the hottest year ever."
 |
| You are here (at "10+" data point) |
 |
| Satellite temps in Red lag PDO in Green by ~6 months |
Wednesday, September 22, 2010
Paper: Current Arctic Sea Ice is More Extensive than Most of the past 9000 Years
A peer-reviewed paper published in the Canadian Journal of Earth Sciences finds that western Arctic sea ice extent at the end of the 20th century was more extensive than most of the past 9000 years. The paper also finds that the western Arctic sea ice extent was on a declining trend over the past 9000 years, but recovered beginning sometime over the past 1000 years and has been relatively stable and extensive since. The paper also demonstrates that even though western annual sea ice extent has been less than the present throughout most of the last 9000 years, low sea ice has consistently failed to cause a planetary albedo 'tipping point' claimed by warmists.
Although it seems like a day doesn't go by without an alarmist headline or blog posting obsessing over the daily Arctic sea ice statistics (and never about Antarctic sea ice extent which reached a record high this year), this paleo-climate perspective takes all the wind out of alarmist sails. Satellite assessment of sea ice conditions is only available beginning in 1979 (around the time the global cooling scare ended), with only sparse data available prior to 1979. The alarmists at the NRDC fraudulently claim in a new video that due to "climate destruction," Arctic sea ice reached the lowest in history in 2010 (actually the low since 1979 was in 2007 and 2010 was the 3rd or 4th lowest depending on the source). Probably wouldn't bring in many donations if they mentioned the truth: the 21st century has some of the highest annual western Arctic sea ice extents over the past 9000 years.
The figure below comes from the paper, but has been modified with the red notations and rotated clockwise. The number of months the sea ice extent is greater than 50% is shown on the y axis. Time is on the x axis starting over 9000 years ago up to the present. Warming periods are shown in gray with the Roman and Medieval warming periods (RWP/MWP) notated, the Minoan Warming Period about 5000 years ago, and another older unnamed warming period. The last dot on the graph is the end of the 20th century and represents one of the highest annual sea ice extents.
 Holocene fluctuations in Arctic sea-ice cover: dinocyst-based reconstructions for the eastern Chukchi Sea Canadian Journal of Earth Sciences, 45: 1377-1397
Authors: J.L. McKay, A. de Vernal, C. Hillaire-Marcel, C. Not, L. Polyak, and D. Darby
Abstract: Cores from site HLY0501-05 on the Alaskan margin in the eastern Chukchi Sea were analyzed for their geochemical (organic carbon, d13Corg, Corg/N, and CaCO3) and palynological (dinocyst, pollen, and spores) content to document oceanographic changes during the Holocene. The chronology of the cores was established from 210Pb dating of near- surface sediments and 14C dating of bivalve shells. The sediments span the last 9000 years, possibly more, but with a gap between the base of the trigger core and top of the piston core. Sedimentation rates are very high (*156 cm/ka), allowing analyses with a decadal to centennial resolution. The data suggest a shift from a dominantly terrigenous to marine input from the early to late Holocene. Dinocyst assemblages are characterized by relatively high concentrations (600–7200 cysts/cm3) and high species diversity, allowing the use of the modern analogue technique for the reconstruction of sea-ice cover, summer temperature, and salinity. Results indicate a decrease in sea-ice cover and a corresponding, albeit much smaller, increase in summer sea-surface temperature over the past 9000 years. Superimposed on these long-term trends are millennial-scale fluctuations characterized by periods of low sea-ice and high sea-surface temperature and salinity that appear quasi-cyclic with a frequency of about one every 2500–3000 years. The results of this study clearly show that sea-ice cover in the western Arctic Ocean has varied throughout the Holocene. More importantly, there have been times when sea-ice cover was less extensive than at the end of the 20th century.
note this is version 2.0 of this post updated to repeatedly emphasize this drilling site was located in the western Arctic. see comments below for details.
Although it seems like a day doesn't go by without an alarmist headline or blog posting obsessing over the daily Arctic sea ice statistics (and never about Antarctic sea ice extent which reached a record high this year), this paleo-climate perspective takes all the wind out of alarmist sails. Satellite assessment of sea ice conditions is only available beginning in 1979 (around the time the global cooling scare ended), with only sparse data available prior to 1979. The alarmists at the NRDC fraudulently claim in a new video that due to "climate destruction," Arctic sea ice reached the lowest in history in 2010 (actually the low since 1979 was in 2007 and 2010 was the 3rd or 4th lowest depending on the source). Probably wouldn't bring in many donations if they mentioned the truth: the 21st century has some of the highest annual western Arctic sea ice extents over the past 9000 years.
The figure below comes from the paper, but has been modified with the red notations and rotated clockwise. The number of months the sea ice extent is greater than 50% is shown on the y axis. Time is on the x axis starting over 9000 years ago up to the present. Warming periods are shown in gray with the Roman and Medieval warming periods (RWP/MWP) notated, the Minoan Warming Period about 5000 years ago, and another older unnamed warming period. The last dot on the graph is the end of the 20th century and represents one of the highest annual sea ice extents.

Authors: J.L. McKay, A. de Vernal, C. Hillaire-Marcel, C. Not, L. Polyak, and D. Darby
Abstract: Cores from site HLY0501-05 on the Alaskan margin in the eastern Chukchi Sea were analyzed for their geochemical (organic carbon, d13Corg, Corg/N, and CaCO3) and palynological (dinocyst, pollen, and spores) content to document oceanographic changes during the Holocene. The chronology of the cores was established from 210Pb dating of near- surface sediments and 14C dating of bivalve shells. The sediments span the last 9000 years, possibly more, but with a gap between the base of the trigger core and top of the piston core. Sedimentation rates are very high (*156 cm/ka), allowing analyses with a decadal to centennial resolution. The data suggest a shift from a dominantly terrigenous to marine input from the early to late Holocene. Dinocyst assemblages are characterized by relatively high concentrations (600–7200 cysts/cm3) and high species diversity, allowing the use of the modern analogue technique for the reconstruction of sea-ice cover, summer temperature, and salinity. Results indicate a decrease in sea-ice cover and a corresponding, albeit much smaller, increase in summer sea-surface temperature over the past 9000 years. Superimposed on these long-term trends are millennial-scale fluctuations characterized by periods of low sea-ice and high sea-surface temperature and salinity that appear quasi-cyclic with a frequency of about one every 2500–3000 years. The results of this study clearly show that sea-ice cover in the western Arctic Ocean has varied throughout the Holocene. More importantly, there have been times when sea-ice cover was less extensive than at the end of the 20th century.
 | |
| Arctic summer sea surface temperatures are also currently lower than much of the past 9000 years |
New Hoax Moniker: Global Climate Destruction
The hoax moniker du jour changed from 'global warming' to 'climate change' and then to 'climate disruption' only a week ago. Now, according to the NRDC, "scientists have been warning us for years to expect this kind of climate destruction as a result of carbon pollution.”
It's hard to keep up with all the alarmist lies and distortions in this 'piece of work.'
Sept. 21, 2010 - Summer 2010 has provided vivid and staggering illustrations of the extreme weather events and dramatic impacts on people’s lives we can expect in the 21st century as global warming continues unabated. The extreme weather fits a pattern long expected by climate scientists as a consequence of climate change and are summarized in a recently released report of temperature data and video of world climate events from the Natural Resources Defense Council (NRDC).
Global warming is dangerously and permanently disrupting our climate. Because the atmosphere can hold more moisture as it warms, there is more rapid evaporation when it is dry and more intense rainfall when it is wet. The result is an increase in severe droughts and floods. As we have seen this year in Russia, Pakistan, China, and the United States, the results can be tragic.
Monsoon-induced floods in Pakistan displaced more than 6 million people and destroyed one million homes. In Russia, the worst heat and drought on record led to the loss of one-third of the wheat crop while rampant wild fires that consumed whole villages. China was besieged by extreme rains leading to devastating mudslides while floods swept through Iowa and Tennessee killing 54 amidst searing, record-setting heat in other parts of the country.
Ten states experienced record-warm summers: Rhode Island, New Jersey, Delaware, Maryland, Virginia, North Carolina, Tennessee, South Carolina, Georgia, and Alabama. Maine, New Hampshire, Vermont, Rhode Island, Connecticut, and New Jersey each had their warmest year-to-date (January-August) period. As a result, U.S. temperature-related energy demand for Summer 2010 was the highest ever putting more pressure on the nation’s energy supply.
“Fall may be here but we should not forget the Summer of 2010 as a harbinger of things to come,” said Dan Lashof, NRDC’s climate center director. “And this should come as no surprise to anyone because scientists have been warning us for years to expect this kind of climate destruction as a result of carbon pollution.”
Lashof pointed to the Fourth Assessment Report of the IPCC published in 2007 which said that “…the type, frequency and intensity of extreme events are expected to change as Earth’s climate changes, and these changes could occur even with relatively small mean climate changes. Changes in some types of extreme events have already been observed, for example, increases in the frequency and intensity of heat waves and heavy precipitation events.”
Of particular interest: average nighttime low temperatures were the hottest ever recorded at nearly one in four of the national weather stations according to the NRDC report. Hot, stagnant nights can prove even more harmful than daytime highs because they are more sensitive to the buildup of heat-trapping pollution in the atmosphere than daytime temperatures and vulnerable populations (particularly the very young and the elderly) are unable to cool down and get relief from the stress of the daytime heat.
But there’s no taking solace in the end of summer. “Even as we take a brief look back at the summer, we’re in the midst of a record-shattering hurricane season,” added Lashof. “It’s a real warning, climate change will have no mercy.”
NRDC Report: The Worst Summer Ever?
'Dark Side of Climate Change' Seen in Record Setting Night-time Temperatures:
http://www.nrdc.org/globalWarming/hottestsummer/
Video: This Is What Global Warming Looks Like
http://www.youtube.com/watch?v=pG41xDxrzI8
Website: www.projectonclimatescience.org
It's hard to keep up with all the alarmist lies and distortions in this 'piece of work.'
| Coming to a planet near you |
Global warming is dangerously and permanently disrupting our climate. Because the atmosphere can hold more moisture as it warms, there is more rapid evaporation when it is dry and more intense rainfall when it is wet. The result is an increase in severe droughts and floods. As we have seen this year in Russia, Pakistan, China, and the United States, the results can be tragic.
Monsoon-induced floods in Pakistan displaced more than 6 million people and destroyed one million homes. In Russia, the worst heat and drought on record led to the loss of one-third of the wheat crop while rampant wild fires that consumed whole villages. China was besieged by extreme rains leading to devastating mudslides while floods swept through Iowa and Tennessee killing 54 amidst searing, record-setting heat in other parts of the country.
Ten states experienced record-warm summers: Rhode Island, New Jersey, Delaware, Maryland, Virginia, North Carolina, Tennessee, South Carolina, Georgia, and Alabama. Maine, New Hampshire, Vermont, Rhode Island, Connecticut, and New Jersey each had their warmest year-to-date (January-August) period. As a result, U.S. temperature-related energy demand for Summer 2010 was the highest ever putting more pressure on the nation’s energy supply.
“Fall may be here but we should not forget the Summer of 2010 as a harbinger of things to come,” said Dan Lashof, NRDC’s climate center director. “And this should come as no surprise to anyone because scientists have been warning us for years to expect this kind of climate destruction as a result of carbon pollution.”
Lashof pointed to the Fourth Assessment Report of the IPCC published in 2007 which said that “…the type, frequency and intensity of extreme events are expected to change as Earth’s climate changes, and these changes could occur even with relatively small mean climate changes. Changes in some types of extreme events have already been observed, for example, increases in the frequency and intensity of heat waves and heavy precipitation events.”
Of particular interest: average nighttime low temperatures were the hottest ever recorded at nearly one in four of the national weather stations according to the NRDC report. Hot, stagnant nights can prove even more harmful than daytime highs because they are more sensitive to the buildup of heat-trapping pollution in the atmosphere than daytime temperatures and vulnerable populations (particularly the very young and the elderly) are unable to cool down and get relief from the stress of the daytime heat.
But there’s no taking solace in the end of summer. “Even as we take a brief look back at the summer, we’re in the midst of a record-shattering hurricane season,” added Lashof. “It’s a real warning, climate change will have no mercy.”
NRDC Report: The Worst Summer Ever?
'Dark Side of Climate Change' Seen in Record Setting Night-time Temperatures:
http://www.nrdc.org/globalWarming/hottestsummer/
Video: This Is What Global Warming Looks Like
http://www.youtube.com/watch?v=pG41xDxrzI8
Website: www.projectonclimatescience.org
Tuesday, September 21, 2010
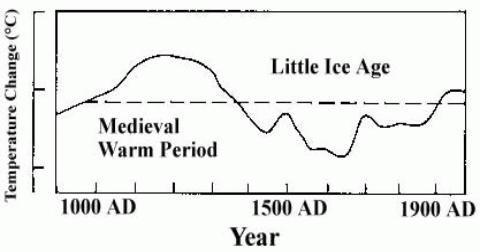
Deja Vu '72?
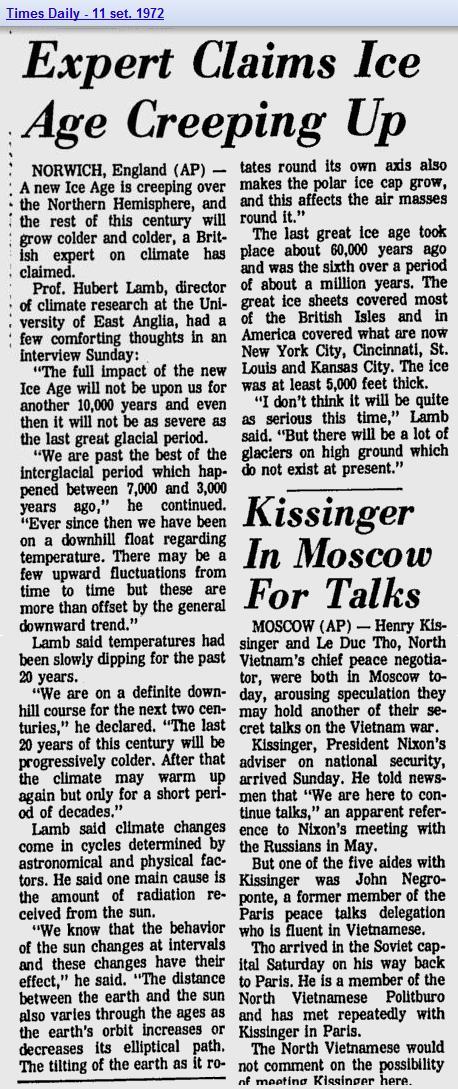

UPDATE: Dr. Lamb was also the source of the paleoclimate graph used in the 1990 & 1995 IPCC reports which shows an inconvenient hotter Medieval Warming Period than the present. The following IPCC report threw away Dr. Lamb's graph in favor of Michael Mann's hockey stick graph, which served to eliminate the Medieval Warming Period. This was the purpose of Mann's hockey stick, as stated in the climategate emails, to eliminate or "contain the MWP" according to Mann.

Paper: Global Cooling began in 2003
Climate scientist Roger Pielke Sr has posted today an in-press paper which demonstrates that ocean temperatures flattened in 2001-2002 and have been on a negative trend since. The ocean temperature trend is far more important than the hopelessly adjusted & flawed land temperature record to assess global warming, as noted by Dr. Pielke. During this period, CO2 levels have steadily climbed, which according to the IPCC should have caused a positive radiative imbalance resulting in about .16C warming. The fact that ocean temperatures have instead been cooling falsifies the entire anthropogenic global warming hypothesis.
 Discussion and Summary
As many authors have noted, knowing FOHC [ocean heat content] is important because of its close relationship to FTOA, the net inward radiative flux at the top of the atmosphere. Wetherald et al. [13] and Hansen et al. [14] believe that this radiative imbalance in Earth’s climate system is positive, amounting recently [14] to approximately 0.9 W/m2. Pielke [15] has pointed out that at least 90% of the variable heat content of Earth resides in the upper ocean. Thus, to a good approximation, FOHC may be employed to infer the magnitude of FTOA, and the positive radiation imbalance should be directly reflected in FOHC (when adjusted for geothermal flux [9]; see Table 1 caption). The principal approximations involved in using this equality, which include the neglect of heat transfers to land masses and those associated with the melting and freezing of ice, estimated to be of the order of 0.04 W/m2 [14], have been discussed by the present authors [9].
In steady state, the state of radiative balance, both quantities FTOA and FOHC should be zero. If FTOA > FOHC, “missing energy” is being produced if no sink other than the ocean can be identified. We note that one recent deep-ocean analysis [16], based on a variety of time periods generally in the 1990s and 2000s, suggests that the deeper ocean contributes on the order of 0.09 W/m2. This is not sufficient to explain the discrepancy.
Trenberth and Fasullo (TF) [2] believe that missing energy has been accumulating at a considerable rate since 2005. According to their rough graph, as of 2010 the missing energy production rate is about 1.0 W/m2, which represents the difference between FTOA ~ 1.4 and FOHC ~ 0.4 W/m2. It is clear that the TF [Trenberth & Fasullo] missing-energy problem is made much more severe if FOHC is negative or even zero. In our opinion, the missing energy problem is probably caused by a serious overestimate by TF of FTOA, which, they state, is most accurately determined by modeling.
In summary, we find that estimates of the recent (2003–2008) OHC rates of change are preponderantly negative. This does not support the existence of either a large positive radiative imbalance or a “missing energy.”
"There is an excellent new paper by Bob Knox and David Douglas that provides further insight into the issue of the monitoring of global climate system heat changes. The paper is
R. S. Knox, David H. Douglass 2010: Recent energy balance of Earth International Journal of Geosciences, 2010, vol. 1, no. 3 (November) In press doi:10.4236/ijg2010.00000."
ABSTRACT: A recently published estimate of Earth’s global warming trend is 0.63 ± 0.28 W/m2, as calculated from ocean heat content anomaly data spanning 1993–2008. This value is not representative of the recent (2003–2008) warming/cooling rate because of a “flattening” that occurred around 2001–2002. Using only 2003–2008 data from Argo floats, we find by four different algorithms that the recent trend ranges from –0.010 to –0.160 W/m2 with a typical error bar of ±0.2 W/m2. These results fail to support the existence of a frequently-cited large positive computed radiative imbalance.

As many authors have noted, knowing FOHC [ocean heat content] is important because of its close relationship to FTOA, the net inward radiative flux at the top of the atmosphere. Wetherald et al. [13] and Hansen et al. [14] believe that this radiative imbalance in Earth’s climate system is positive, amounting recently [14] to approximately 0.9 W/m2. Pielke [15] has pointed out that at least 90% of the variable heat content of Earth resides in the upper ocean. Thus, to a good approximation, FOHC may be employed to infer the magnitude of FTOA, and the positive radiation imbalance should be directly reflected in FOHC (when adjusted for geothermal flux [9]; see Table 1 caption). The principal approximations involved in using this equality, which include the neglect of heat transfers to land masses and those associated with the melting and freezing of ice, estimated to be of the order of 0.04 W/m2 [14], have been discussed by the present authors [9].
In steady state, the state of radiative balance, both quantities FTOA and FOHC should be zero. If FTOA > FOHC, “missing energy” is being produced if no sink other than the ocean can be identified. We note that one recent deep-ocean analysis [16], based on a variety of time periods generally in the 1990s and 2000s, suggests that the deeper ocean contributes on the order of 0.09 W/m2. This is not sufficient to explain the discrepancy.
Trenberth and Fasullo (TF) [2] believe that missing energy has been accumulating at a considerable rate since 2005. According to their rough graph, as of 2010 the missing energy production rate is about 1.0 W/m2, which represents the difference between FTOA ~ 1.4 and FOHC ~ 0.4 W/m2. It is clear that the TF [Trenberth & Fasullo] missing-energy problem is made much more severe if FOHC is negative or even zero. In our opinion, the missing energy problem is probably caused by a serious overestimate by TF of FTOA, which, they state, is most accurately determined by modeling.
In summary, we find that estimates of the recent (2003–2008) OHC rates of change are preponderantly negative. This does not support the existence of either a large positive radiative imbalance or a “missing energy.”
Monday, September 20, 2010
CO2 is a bit player in Global Warming
An essay by Richard Petschauer, Carbon Dioxide Heat Trapping: Merely a Bit Player in Global Warming, shows that IPCC estimates of climate sensitivity to CO2 are greatly exaggerated. The author utilizes the Spectracalc spectral analysis program to determine the ability of the 'greenhouse' gas CO2 to absorb the long wave infrared energy emitted from the Earth's surface (a stepwise spectral line-by-spectral line "integral" of the area under the curve). He finds that at present CO2 levels, only 7.4% of heat radiated from the Earth is absorbed by CO2 and that the vast majority of heat absorption is due to water vapor. Furthermore, a doubling of CO2 levels only results in the absorption by CO2 increasing to 8.0%, a 4x increase to 8.7%, and 8x increase to 9.6%. [the following 2 paragraphs are not from the Petschauer essay]
As a first approximation to determine 'climate sensitivity' (change in temperature due to a doubling of CO2), one might assume the total so-called 'greenhouse effect' of 33C is correct, multiply that by the % change in absorption due to doubled CO2 (0.6%), to arrive at a climate sensitivity of only 0.198C. This is a far cry from the climate sensitivity figures of 2 - 4.5C claimed by the IPCC. The empirical data to date also supports a climate sensitivity of <1C (refs 1,2,3,4,5,6...)
Furthermore, one would need to assume that 'greenhouse gases' at an average temperature ranging between ~ -10C to -18C are capable of heating a hotter body (Earth's surface at 15C) in violation of the second law of thermodynamics. For those who believe a radiating colder body can heat a radiating warmer body, try placing an object at -18C close to another object at 15C and then report back on whether the 15C object increases its temperature. Believe it or not, this absurdity is the basis of global warming alarmism.
 |
| Region of interest of CO2 LWIR (long wave infrared) absorption |
 |
| Blowup of region of interest showing overlap between CO2 and water vapor shaded area is absorbed by CO2 only |
 |
| Blowup of above figure. Area with asterisk is absorbed by CO2 only. |
ABSTRACT: New calculations show that doubling of carbon dioxide (CO2) will increase average global temperature by only about 1F (degrees Fahrenheit) or 0.55C (degrees Centigrade), much less than the range of 2C to 4.5C estimated by the United Nations International Panel on Climate Change (IPCC). These new calculations are based on NASA supported spectral calculations available on the Internet relating to greenhouse gases. The temperature increases are estimated to be somewhat more in winter in the colder climates because of reduced competing atmosphere water vapor, but smaller increases at other times and places. These calculations also estimate that a 10% increase of water vapor in the atmosphere, a stronger greenhouse gas than CO2, or a reduction in the average cloud cover of only about 2 percent, will increase global temperature about as much as doubling CO2 would. Each additional doubling of CO2 will cause further temperature increases about the same as that caused by the first doubling. Greenhouse gases, except water vapor, only trap heat at certain narrow wavelengths of infrared radiation related to their molecular structures. Data shows that present concentrations of CO2, a strong absorber, are already well above the saturation value at its principal wavelength, so increases in it have a relative small affect. These new calculations are based on atmospheric models of the energy absorption bandwidths of greenhouse gases coupled with Max Planck’s equations relating to infrared wavelength distributions. A new simple technique is also proposed in the appendix to measure actual trapped heat being radiated back from the atmosphere to the Earth. This can be used to evaluate validate various estimating models. It also indicates that the role of clouds and their height above the Earth may have a larger role than previously thought. Since clouds operate as both powerful heat-trapping agents, overriding others, and a reflector of the sun’s energy, they may be the key factor in the regulation of the average global temperature. At the present time, they are one of the least measured parameters in the computer models predicting future climate changes. Weather and climate forecasting considering all factors is very complex, thus this paper does not cover that subject. However it is felt that the simple role of long-term heat rises due to only CO2 changes is a much simpler process and better estimated by basic models as used herein. Certain shortcomings in the IPCC data and estimates, as reported by others, are also summarized. Based on this new information, recommendations are made regarding future U.S. energy policy. While it does appear that the recent years show a warming trend, the role of CO2 in this is very small, and perhaps beneficial in moderating winter temperatures in colder climates.
h/t comment by Scottar alerting me to this essay
h/t comment by Scottar alerting me to this essay
Sunday, September 19, 2010
The 'Green Jobs' Fallacy of Al Gore

Losing Green Jobs September 19, 2010 by Al Gore
Every day we fail to take action, we export green jobs and our technological advantage to China. While some deniers claim there are no green jobs, just last week The New York Times pointed to this story:
“With erect posture and clear gray eyes, Chuck Provini still looks like the Marine who graduated from the Naval Academy in 1969 and was repeatedly decorated for bravery in Vietnam.”
“He fumes at strangers who call him a traitor for agreeing to manufacture in Zhuzhou, China, a new solar panel production device that his company developed in the United States.”
“I love my country,” said Mr. Provini, chief executive of 10-employee Natcore Technology in Red Bank, N.J. “It makes me crazy that I’ve got countries that want to do things with us, but not here.”
Al: we are 'creating' temporary green jobs here in the USA- just look at these results from the Obama stimulus program:
- cost of $1.39 million/job to install smart meters in Chattanooga, TN. (Project #51)
- cost of $985,000/job to install solar panels at the Denver Federal Center. (Project #41)

And Al - what was that thing about global warming?
Obama's Climate Policy has wrong priorities & based on factual errors
Bjorn Lomborg, author of The Skeptical Environmentalist, and who maintains that he is not a bjorn-again climate "denier," is nonetheless highly critical of the Obama administration climate policies. Lomborg states the Obama policies have the wrong priorities such as calling for reduced CO2 emissions to avoid extreme weather events and to avoid 'increasing' world hunger (both of which have been on a declining trend and would not be affected by CO2). Lomberg also notes the policies are based on 4 serious factual errors: 1) that famine is increasing, 2) sea levels are rising dangerously, 3) droughts are increasing, and 4) storms are growing stronger. For the papers refuting each of these fallacies and a summary of Lomborg's arguments, click on the graphic below:
 |
| Click on graphic for pdf file |
Thursday, September 16, 2010
California Climate change is caused by the Pacific Decadal Oscillation Not by Carbon Dioxide
A recommended new SPPI paper by Roy Clark, PhD:
 ABSTRACT: The long term trends in monthly minimum temperature from 34 California weather stations have been analyzed. These trends can be explained using a variable linear urban heat island effect superimposed on a baseline trend from the Pacific Decadal Oscillation (PDO). The majority of the prevailing California weather systems originate in the N. Pacific Ocean. The average minimum monthly temperature is a measure of the surface air temperature of these weather systems. Changes in minimum surface temperature are an indicator of changes in the temperature of the tropospheric air column, not the ground surface temperature. The PDO provides a baseline minimum temperature trend that defines the California climate variation. This allows urban heat island effects and other possible anomalous temperature measurement effects to be identified and investigated. Some of the rural weather stations showed no urban heat island effects. Stations located in urban areas showed heat island effects ranging from 0.01 to over 0.04 C.yr-1. The analysis of minimum temperature data using the PDO as a reference baseline has been demonstrated as a powerful technique for climate trend evaluation. This technique may be extended to other regions using the appropriate local ocean surface temperature reference. The analysis found no evidence for CO2 induced warming trends in the California data. This confirms prior ‘Null Hypothesis’ work that it is impossible for a 100 ppm increase in atmospheric CO2 concentration to cause any climate change.
 CONCLUSIONS: The dominant factor that determines the climate of the State of California is the variation in N. Pacific Ocean temperatures related to the PDO. This has been clearly demonstrated by an analysis of the long term minimum temperature data from 34 widely spaced California weather stations. The PDO record provides a baseline that can be used to identify urban heat island effects and anomalous data in the station records. This provides a powerful technique for investigating climate change in California and may be extended to other Western States and other areas of the world where there is an ocean influence on the climate that may be used to provide a local reference. Unexplained ‘adjustments’ made to weather station records for use in climate trend analysis have now become a major concern.[7,8] This technique may also provide an independent reference for the analysis of climate trends in weather station data to detect such ‘adjustments’. This analysis used a simple linear fit to the station data. By combining the weather station data with other meteorological data and climate simulations, a more detailed analysis of the effect the PDO and other factors on the climate of the State of California may be performed. However, this is not a ‘one size fits all’ approach and each data set needs to be examined carefully on a case by case basis to evaluate all of the factors that may bias the data. These results also confirm earlier work which demonstrated that it was impossible for the observed changes in atmospheric CO2 concentration to cause any climate change.[2] There is no CO2 ‘signature’ in any of the temperature records that were analyzed. The recent decrease in the PDO with the triple peak ‘signature’ from 1985 onwards is clearly visible in most of the temperature data sets. Predictions for CO2 induced global warming indicate a monotonically increasing ‘equilibrium surface temperature’ for this period. The empirical concept of CO2 induced global warming has no basis in the physical reality of climate change.
Note: Dr. Roy Clark's work on the CO2 'null hypothesis' is incorporated in the post Why greenhouse gases won't heat the oceans


Note: Dr. Roy Clark's work on the CO2 'null hypothesis' is incorporated in the post Why greenhouse gases won't heat the oceans
Good News: New climate models incorporate UHI Bad News: Only focus on CO2
Capturing heat islands in climate models
September 9, 2010 | A team of scientists led by NCAR’s Keith Oleson has incorporated urban areas into a global climate model. The development is important because most models used for predicting future climate change do not account for the urban “heat island” effect. The study will be published in the International Journal of Climatology.
Oleson and colleagues used the Community Climate System Model, an NCAR-based model that uses trillions of calculations to simulate the chemical and physical processes that drive Earth’s climate. After inserting a parameterization for urban surfaces into the CCSM’s land surface component, the researchers ran the model from present day to 2100 under the Intergovernmental Panel on Climate Change (IPCC) A2 emissions scenario, which assumes that global fossil fuel emissions will continue to rise at high levels over the coming century.
Results from the modeling experiment show that present-day annual mean urban air temperatures are up to 4°C warmer than temperatures for surrounding rural areas, a finding that is important for verifying the model’s accuracy since scientists already have observational evidence that urban areas are warmer than surrounding rural areas.
The study found that both urban and rural areas warm substantially by the end of this century as emissions rise, with rural areas warming slightly more than urban—resulting in a decrease in the urban-to-rural contrast. In addition, nighttime urban warming is much greater than daytime urban warming, resulting in a reduced diurnal range in temperature compared to rural areas.
“This study demonstrates that climate models need to begin to account for urban surfaces to more realistically evaluate the impact of climate change on people in the environments where they live,” Oleson says.
He cautions that the study does not account for urban growth or changes in urban form or function; nor does it account for changes in the atmosphere other than increased carbon dioxide concentrations, such as aerosols or other kinds of pollution.
[or account for ocean oscillations, clouds, solar UV activity- which is much more variable than previously thought, negative feedback from water vapor, etc. etc.]
 |
| This pair of satellite images provides two views of Atlanta, with the city’s urban core at the center of both images. The top image is a photo-like view of the area, while the bottom image is a land surface temperature map with cooler temperatures in yellow and hotter temperatures in red. Because vegetation cools Earth’s surface through evaporation, the most densely vegetated areas (darkest green in top image) are the coolest areas (palest yellow in bottom image). |
Tuesday, September 14, 2010
The cognitive dissonance of AGW

September 14, 2010
EcoAlert: Ice Sheets Act as Giant Solar Mirrors Controlling Future Climate Change

The giant ice sheets of Antarctica behave like mirrors, reflecting the sun's energy and moderating the world's temperatures. The waxing and waning of these ice sheets contribute to changes in sea level and affect ocean circulation, which regulates our climate by transporting heat around the planet.
Despite their present-day frigid temperatures, the poles were not always covered with ice. New climate records recovered from Antarctica during the recent Integrated Ocean Drilling Program "Wilkes Land Glacial History" Expedition show that approximately 53 million years ago, Antarctica was a warm, sub-tropical environment. During this same period, known as the "greenhouse" or "hothouse" world, atmospheric CO2 levels exceeded those of today by ten times.
Then suddenly, Antarctica's lush environment transitioned into its modern icy realm. In only 400,000 years concentrations of atmospheric carbon dioxide decreased. Global temperatures dropped. Ice sheets developed and Antarctica became ice-bound.
How did this change happen so abruptly and how stable can we expect ice sheets to be in the future?
To answer these questions, an international team of scientists participating in the Wilkes Land Glacial History Expedition spent two months aboard the scientific research vessel JOIDES Resolution in early 2010, drilling geological samples from the seafloor near the coast of Antarctica. Despite negotiating icebergs, near gale-force winds, snow, and fog, they managed to recover approximately 2,000 meters (over one mile) of sediment core.
"These sediments are essential to our research because they preserve the history of the Antarctic ice sheet," observed Dr. Carlota Escutia of the Research Council of Spain CSIC-University of Granada, who led the expedition, along with co-chief scientist Dr. Henk Brinkhuis of Utrecht University in the Netherlands. "We can read these sediments like a history book," Brinkhuis explained. "And this book goes back 53 million years, giving us an unprecedented record of how ice sheets form and interact with changes in the climate and the ocean."
Wilkes Land is the region of Antarctica that lies due south of Australia, and is believed to be one of the more climate-sensitive regions of the polar continent. The new core samples collected during IODP's Wilkes Land expedition are unique because they provide the world's first direct record of waxing and waning of ice in this region of Antarctica.
Combined, the cores tell the story of Antarctica's transition from an ice-free, warm, greenhouse world to an ice-covered, cold, dry "icehouse" world. Sediments and microfossils preserved within the cores document the onset of cooling and the development of the first Antarctic glaciers and the growth and recession of Antarctica's ice sheets. Cores from one site resemble tree rings - unprecedented alternating bands of light and dark sediment preserve seasonal variability of the last deglaciation that began some 10,000 years ago.
Understanding the behavior of Antarctica's ice sheets plays a fundamental role in our ability to build robust, effective global climate models, which are used to predict future climate. "These models rely on constraints imposed by data from the field," the co-chiefs pointed out. "Measurements of parameters such as age, temperature, and carbon dioxide concentration provide invaluable inputs that help increase the accuracy of these models. The more we can constrain the models, the better they'll perform - and the better we can predict ice sheet behavior." [thought the science was already settled]
The science team now embarks on a multi-year process of on-shore analyses to further investigate the Wilkes Land cores. Age-dating and chemistry studies among other analyses are expected to resolve changes in Antarctica's climate over unprecedented short timescales (50-20,000 years).
Data collected from the Wilkes Land expedition will complement previous research from drilling operations conducted elsewhere in the Antarctic over the last 40 years. Together, this research will provide important age constraints for models of Antarctic ice sheet development and evolution, thereby forming the basis for models of future ice sheet behavior and polar climatic change.
Jason McManus via Integrated Ocean Drilling Program Management International and Physorg.com
Scientist: There is no observational evidence for influence of CO2 on present or past climate
Dr. Ir. Noor van Andel, former head of research at Akzo Nobel, recently presented a talk at the Dutch Meteorological Institute KNMI, concluding there is
• No observational evidence for influence of CO2 on past or present climate
• Rising Outgoing Long-wave radiation with more than 3.7 W/m^2 per ºC SST cannot be the effect of rising CO2 or of the increase of other “greenhouse” gases. Rising OLR/SST with 8.6 W/m^2K means that the atmosphere has become more transparent to IR radiation in the past 60 years. The “greenhouse effect” has become less.
• Solar constant and the properties of water determine our climate
• Rising surface temperature is tightly controlled by increasing wet convection and concomitant upper tropospheric drying
• Strong observational correlation of solar magnetic activity with climate temperatures, presumably via cloud condensation nucleation and albedo [the cosmic ray theory of Svensmark et al]
A few slides from the highly recommended presentation:


h/t via climategate.nl
More proof of natural glacier retreat over the past 5000 years
before industrialization, and no proof that it is due to man
Q: how did a 3,400 year old shoe get under a glacier?
JUVFONNA, Norway, Sept 14 (Reuters) - Climate change is exposing reindeer hunting gear used by the Vikings' ancestors faster than archaeologists can collect it from ice thawing in northern Europe's highest mountains.
"It's like a time machine...the ice has not been this small for many, many centuries," said Lars Piloe, a Danish scientist heading a team of "snow patch archaeologists" on newly bare ground 1,850 metres (6,070 ft) above sea level in mid-Norway.
Specialised hunting sticks, bows and arrows and even a 3,400-year-old leather shoe have been among finds since 2006 from a melt in the Jotunheimen mountains, the home of the "Ice Giants" of Norse mythology.
As water streams off the Juvfonna ice field, Piloe and two other archaeologists -- working in a science opening up due to climate change -- collect "scare sticks" they reckon were set up 1,500 years ago in rows to drive reindeer towards archers.
But time is short as the Ice Giants' stronghold shrinks.
"Our main focus is the rescue part," Piloe said on newly exposed rocks by the ice. "There are many ice patches. We can only cover a few...We know we are losing artefacts everywhere."
Freed from an ancient freeze, wood rots in a few years. And rarer feathers used on arrows, wool or leather crumble to dust in days unless taken to a laboratory and stored in a freezer.
Jotunheimen is unusual because so many finds are turning up at the same time -- 600 artefacts at Juvfonna alone.
Other finds have been made in glaciers or permafrost from Alaska to Siberia. Italy's iceman "Otzi", killed by an arrow wound 5,000 years ago, was found in an Alpine glacier in 1991. "Ice Mummies" have been discovered in the Andes.
RESCUE
Patrick Hunt, of Stanford University in California who is trying to discover where Carthaginian general Hannibal invaded Italy in 218 BC with an army and elephants, said there was an "alarming rate" of thaw in the Alps.
"This is the first summer since 1994 when we began our Alpine field excavations above 8,000 ft (2,438 m) that we have not been inundated by even one day of rain, sleet and snow flurries," he said.
"I expect we will see more 'ice patch archaeology discoveries'," he said. Hannibal found snow on the Alpine pass he crossed in autumn, according to ancient writers.
Glaciers are in retreat from the Andes to the Alps, as a likely side-effect of global warming caused by human emissions of greenhouse gases, the U.N. panel of climate experts says.
The panel's credibility has suffered since its 2007 report exaggerated a thaw by saying Himalayan glaciers might vanish by 2035. It has stuck to its main conclusion that it is "very likely" that human activities are to blame for global warming.
"Over the past 150 years [i.e. started before industrialization with emergence from the Little Ice Age] we have had a worldwide trend of glacial retreat," said Michael Zemp, director of the Swiss-based World Glacier Monitoring Service. While many factors were at play, he said "the main driver is global warming". [and how do you know it is different this time vs. multiple other times thousands of years ago?]
In Norway, "some ice fields are at their minimum for at least 3,000 years," said Rune Strand Oedegaard, a glacier and permafrost expert from Norway's Gjoevik University College.
The front edge of Jovfunna has retreated about 18 metres (60 ft) over the past year, exposing a band of artefacts probably from the Iron Age 1,500 years ago, according to radiocarbon dating. Others may be from Viking times 1,000 years ago.
Juvfonna, about 1 km across on the flank of Norway's highest peak, Galdhoepiggen, at 2,469 metres, also went through a less drastic shrinking period in the 1930s, Oedegaard said.
REINDEER
Inside the Juvfonna ice, experts have carved a cave to expose layers of ice dating back 6,000 years. Some dark patches turned out to be ancient reindeer droppings -- giving off a pungent smell when thawed out.
Ice fields like Juvfonna differ from glaciers in that they do not slide much downhill. That means artefacts may be where they were left, giving an insight into hunting techniques.
On Juvfonna, most finds are "scare sticks" about a metre long. Each has a separate, flapping piece of wood some 30 cm long that was originally tied at the top. The connecting thread is rarely found since it disintegrates within days of exposure.
"It's a strange feeling to be tying a string around this stick just as someone else did maybe 1,500 years ago," said Elling Utvik Wammer, a archaeologist on Piloe's team knotting a tag to a stick before storing it in a box for later study.
All the finds are also logged with a GPS satellite marker before being taken to the lab for examination.
The archaeologists reckon they were set up about two metres apart to drive reindeer towards hunters. In summer, reindeer often go onto snow patches to escape parasitic flies.
Such a hunt would require 15 to 20 people, Piloe said, indicating that Norway had an organised society around the start of the Dark Ages, 1,500 years ago. Hunters probably needed to get within 20 metres of a reindeer to use an iron-tipped arrow.
"You can nearly feel the hunter here," Piloe said, standing by a makeshift wall of rocks exposed in recent weeks and probably built by an ancient archer as a hideaway.
Q: how did a 3,400 year old shoe get under a glacier?
JUVFONNA, Norway, Sept 14 (Reuters) - Climate change is exposing reindeer hunting gear used by the Vikings' ancestors faster than archaeologists can collect it from ice thawing in northern Europe's highest mountains.
"It's like a time machine...the ice has not been this small for many, many centuries," said Lars Piloe, a Danish scientist heading a team of "snow patch archaeologists" on newly bare ground 1,850 metres (6,070 ft) above sea level in mid-Norway.
Specialised hunting sticks, bows and arrows and even a 3,400-year-old leather shoe have been among finds since 2006 from a melt in the Jotunheimen mountains, the home of the "Ice Giants" of Norse mythology.
As water streams off the Juvfonna ice field, Piloe and two other archaeologists -- working in a science opening up due to climate change -- collect "scare sticks" they reckon were set up 1,500 years ago in rows to drive reindeer towards archers.
But time is short as the Ice Giants' stronghold shrinks.
 |
| The heating & cooling of Greenland over the past 8000 years |
"Our main focus is the rescue part," Piloe said on newly exposed rocks by the ice. "There are many ice patches. We can only cover a few...We know we are losing artefacts everywhere."
Freed from an ancient freeze, wood rots in a few years. And rarer feathers used on arrows, wool or leather crumble to dust in days unless taken to a laboratory and stored in a freezer.
Jotunheimen is unusual because so many finds are turning up at the same time -- 600 artefacts at Juvfonna alone.
Other finds have been made in glaciers or permafrost from Alaska to Siberia. Italy's iceman "Otzi", killed by an arrow wound 5,000 years ago, was found in an Alpine glacier in 1991. "Ice Mummies" have been discovered in the Andes.
RESCUE
Patrick Hunt, of Stanford University in California who is trying to discover where Carthaginian general Hannibal invaded Italy in 218 BC with an army and elephants, said there was an "alarming rate" of thaw in the Alps.
"This is the first summer since 1994 when we began our Alpine field excavations above 8,000 ft (2,438 m) that we have not been inundated by even one day of rain, sleet and snow flurries," he said.
"I expect we will see more 'ice patch archaeology discoveries'," he said. Hannibal found snow on the Alpine pass he crossed in autumn, according to ancient writers.
Glaciers are in retreat from the Andes to the Alps, as a likely side-effect of global warming caused by human emissions of greenhouse gases, the U.N. panel of climate experts says.
The panel's credibility has suffered since its 2007 report exaggerated a thaw by saying Himalayan glaciers might vanish by 2035. It has stuck to its main conclusion that it is "very likely" that human activities are to blame for global warming.
"Over the past 150 years [i.e. started before industrialization with emergence from the Little Ice Age] we have had a worldwide trend of glacial retreat," said Michael Zemp, director of the Swiss-based World Glacier Monitoring Service. While many factors were at play, he said "the main driver is global warming". [and how do you know it is different this time vs. multiple other times thousands of years ago?]
In Norway, "some ice fields are at their minimum for at least 3,000 years," said Rune Strand Oedegaard, a glacier and permafrost expert from Norway's Gjoevik University College.
The front edge of Jovfunna has retreated about 18 metres (60 ft) over the past year, exposing a band of artefacts probably from the Iron Age 1,500 years ago, according to radiocarbon dating. Others may be from Viking times 1,000 years ago.
Juvfonna, about 1 km across on the flank of Norway's highest peak, Galdhoepiggen, at 2,469 metres, also went through a less drastic shrinking period in the 1930s, Oedegaard said.
REINDEER
Inside the Juvfonna ice, experts have carved a cave to expose layers of ice dating back 6,000 years. Some dark patches turned out to be ancient reindeer droppings -- giving off a pungent smell when thawed out.
Ice fields like Juvfonna differ from glaciers in that they do not slide much downhill. That means artefacts may be where they were left, giving an insight into hunting techniques.
On Juvfonna, most finds are "scare sticks" about a metre long. Each has a separate, flapping piece of wood some 30 cm long that was originally tied at the top. The connecting thread is rarely found since it disintegrates within days of exposure.
"It's a strange feeling to be tying a string around this stick just as someone else did maybe 1,500 years ago," said Elling Utvik Wammer, a archaeologist on Piloe's team knotting a tag to a stick before storing it in a box for later study.
All the finds are also logged with a GPS satellite marker before being taken to the lab for examination.
The archaeologists reckon they were set up about two metres apart to drive reindeer towards hunters. In summer, reindeer often go onto snow patches to escape parasitic flies.
Such a hunt would require 15 to 20 people, Piloe said, indicating that Norway had an organised society around the start of the Dark Ages, 1,500 years ago. Hunters probably needed to get within 20 metres of a reindeer to use an iron-tipped arrow.
"You can nearly feel the hunter here," Piloe said, standing by a makeshift wall of rocks exposed in recent weeks and probably built by an ancient archer as a hideaway.
Subscribe to:
Posts (Atom)