Thursday, May 6, 2010

A Battle for Sensitivity

"Sensitivity" to a climate scientist refers to the expected change in global temperature due to a doubling of CO2 levels. Thus far, all papers which have calculated sensitivity on the basis of empirical satellite or weather balloon data have found sensitivity to be far less than what is assumed by the computer models of the IPCC. A highly recommended new paper by Dr. Bill Gray adds to the list of papers which find sensitivity to be quite low: 0.5°C due to a doubling of CO2:

GCMs=General Circulation Models
This paper (and all of the other papers based on empirical data) finds increased CO2 leads to a negative feedback upon water vapor, rather than positive as assumed by the IPCC. The 0.5°C sensitivity is in very close agreement with all of the other papers based on empirical data rather than virtual computer models. Meanwhile, Gavin Schmidt et al at NASA/GISS continue to fiddle with their computer models rather than test them against inconvenient satellite data, and lo and behold come to the conclusion that the IPCC models underestimate sensitivity 30-50%. Gavin makes this proclamation on the basis of computer modeling of the climate 3 million years ago, which given the unproven assumption that CO2 controls all, would require higher climate sensitivity to account for higher temperatures during the Pliocene (2.5-5.5 million years ago). However, had Gavin done the same with the rest of the geologic record -600 million years of which are shown below - he could not possibly come to the same conclusion since CO2 levels show no correlation with temperatures, and CO2 levels were up to 18 times higher than the present throughout an entire ice age about 450 million years ago:
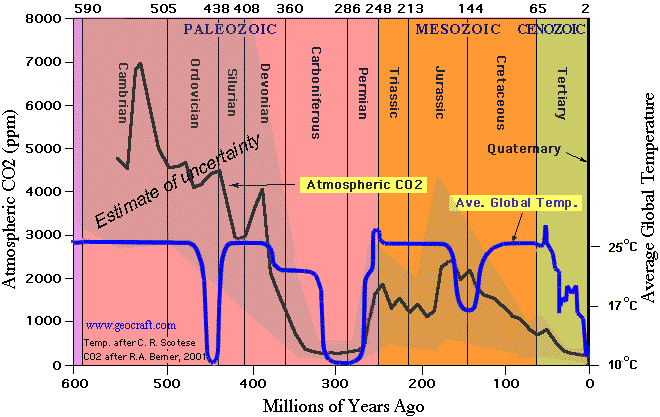


 The NASA/GISS/IPCC models are disproven by satellite and balloon data and by the geologic record.


UPDATE: Dr. Roy Spencer's post today also finds climate sensitivity to be 0.5°C and states:

"These results suggest that the sensitivity of the real climate system is less than that exhibited by ANY of the IPCC climate models. This will end up being a serious problem for global warming predictions. You see, while modelers claim that the models do a reasonably good job of reproducing the average behavior of the climate system, it isn’t the average behavior we are interested in. It is how the average behavior will CHANGE.


And the above results show that not one of the IPCC climate models behaves like the real climate system does when it comes to feedbacks during interannual climate variations…and feedbacks are what determine how serious manmade global warming will be."

Wednesday, May 5, 2010

EIA Reports Record-setting 7-percent Decline in 2009 U.S. CO2 Emissions‏

CO2 emissions declining without the "help" of legislation

EIA FOR IMMEDIATE RELEASE  MAY 5, 2010


In 2009, energy-related carbon dioxide emissions in the United States saw their largest absolute and percentage decline (405 million metric tons or 7.0 percent) since the start of U.S. Energy Information Administration's (EIA) comprehensive record of annual energy data that begins in 1949.


Today EIA released an analysis of the factors affecting this decline. "The large decline in emissions was driven by the economic downturn, combined with an ongoing trend toward a less energy-intensive economy and a decrease in the carbon-intensity of the energy supply," said EIA Administrator Richard Newell.


In addition to a decline in gross domestic product (GDP) in 2009 of 2.4 percent, the energy intensity of the economy (energy consumed per dollar of GDP) declined 2.4 percent and the carbon intensity of the energy supply (carbon dioxide per unit of energy consumed) declined by 2.3 percent. The latter two factors led to a decline in the overall carbon intensity of the economy (carbon dioxide per dollar of GDP) of over 4.5 percent between 2008 and 2009.

The analysis can be found on EIA's website at: http://www.eia.doe.gov/oiaf/environment/emissions/carbon/


The emissions data upon which the analysis is based can be found at: http://www.eia.doe.gov/emeu/mer/environ.html

The Insanity of California's Greenhouse Gas Legislation

Cost to "avoid" global warming: $1.3 Quadrillion per Degree


Suspend disbelief for a moment and just assume that man-made CO2 causes global warming...

And assume that California's Global Warming Solutions Act (AB 32) goes into effect and is not delayed by the increasingly impoverished citizens of California... what would the cost/assumed benefits ratio be?


Let's do a back-of-the-envelope calculation, since it apparently wasn't done by California legislators:


  • USA accounts for 19.3% of global anthropogenic CO2 emissions

  • California has 12% of the US population

  • Percent reduction of California anthropogenic emissions by 2020 (AB 32 goal): 25%

  • Global CO2 man-made emissions (2006): 30.2 billion tons


Thus, if AB 32 meets its goal of reducing California CO2 contributions 25% by 2020 (unlikely), the California reduction of global man-made CO2 emissions would be approximately:


30,200,000,000*.193*.12*.25= 174,858,000 tons


And since:

  • Global man-made CO2 emissions since 1/1/60 are 1 trillion tons

  • Global warming since 1/1/60 is claimed to be ~0.5°C

  • The IPCC assumes almost all (97%) global warming is due to man-made CO2 and that man-made CO2 remains in the atmosphere hundreds to infinite years


Thus, global warming per ton of man-made CO2 would be 0.5/1,000,000,000,000 = 0.0000000000005°C per ton


Thus, the "global warming avoided" due to AB 32 would be 174,858,000*.0000000000005 = 0.000087429°C (about 9 hundred thousandths of 1 degree)


and since the cost of AB 32 (direct & indirect) is at least $116 Billion, the cost to "avoid global warming" per 1°C would be  $116,000,000,000/.000087429 = $1,326,790,881,744,043 ($1.3 Quadrillion per degree). Note: Global GDP (61.1 trillion) is less than 5% of this amount. Looks like the cost/(assumed benefits) ratio is rather high, even if you are a true believer.